Risk
Why Am I Talking About Risk
First order of business - why the hell do you care what I have to say about risk? Having worked as a stock trader at a bank in the past, I think I have some experience in the department of risk taking that could be worth sharing. During this time of my life, the management of - and exposure to - risk were at the forefront of my daily life. I have since moved job and now work as a Quant at a hedge fund, modelling - among other things - the probabilities of future events happening. While I don’t claim to be an expert on risk, I believe I have an above average understanding of the topic and could share some useful insights. That being said, if you are a professor of statistics, or a hedge fund manager, I would think (or hope) that you won’t get as much out of reading this.
What is Risk
First things first though, we should establish a clear definition of risk. In doing this, I reached out to some friends and asked them how they would define risk. Here are their responses:
- “Standard deviation from expected value”
- “A non-removable chance of loss”
- “Chance of a negative variable outcome”
This highlights an intriguing aspect of risk: the lack of a universally agreed-upon definition. Different individuals perceive risk in different ways, based on their experiences, knowledge, and preferences. So, how do we decide which of two games or gambles is riskier?
Let’s look at each answer in turn.
Uncertainty
One of the ways we can look at risk is as uncertainty, reflecting our inability to precisely predict outcomes. It can also be defined in terms of volatility or variance. Standard deviation from the expected value encompasses both positive and negative deviations from the expected outcome. However, it raises an interesting question: does upside risk still fall under the umbrella of risk?
This says that if we sample a distribution, the average deviation from the expected value will be the defined by the expression above.
The Possibility of a Negative Outcome
Moreover, risk can be defined as the possibility of a negative outcome. The word “possibility” is key here. What if the negative outcome has a probability of 1? I would not call it risky if something bad was certain to happen. It’s not good, but it isn’t risky either. So it’s clear that a risky event includes a probability that lies strictly between 0 and 1.
Unhedgable Exposure
Finally, what if the risky event is preventable? Non-removable chances of loss goes further to suggest that something is not necessarily risky if you can take action to remove the risk, for example hedging a position in a portfolio. While I acknowledge that others may not see this as risk, for the purpose of this essay, I consider any risk that is not hedged but could be, to still be a risk. It is just one you are choosing to take. I’ll save the rest of the discussion for when I get onto talking about hedging.
What is a Bad Outcome
So if risk is a non-zero, non-certain probability of a negative outcome. The next logical step is to determine what we mean by a negative outcome. We need to establish a threshold that differentiates between acceptable and unacceptable results. The obvious one is expected value—the amount we anticipate gaining or losing. This threshold aligns with our perceived utility or worth.
Let’s consider an example. Suppose I offer you a gamble by flipping a coin. If it lands on heads, you win £105. If it lands on tails, you receive £5. On the surface, it seems that both outcomes are positive. However, if we evaluate it against our expected value threshold, a discrepancy arises. The expected value of this gamble is (£105 + £5) / 2 = £55. While you still gain in either outcome, you might feel somewhat disappointed if the coin were to land on tails. This demonstrates how our perception of a negative outcome is determined by comparing it to our expectations (on a philosophical note, this suggests a good way to avoid negative outcomes is to lower - or even eliminate - our expectations).
I believe that using expected value as the threshold for negative outcomes is a sensible approach in most cases. It aligns with the notion that our utility and assessment of outcomes are based on the expected value of a given scenario, which we’ll dive into further when talking about some behavioural biases surrounding risk.
Opportunity Cost
So far we have been talking about the possibility that a bad thing happens, but what about if a good thing doesn’t happen? In our previous coin flip example, we could say the risk is that we DO NOT get the £105. This is called opportunity cost. Opportunity cost is a hidden risk that arises from not making an investment that would have yielded profits. It doesn’t manifest as a negative utility, but rather as a failure to realise a positive one.
Let’s say you’re walking down the street and you see a £5 note on the floor. You think about picking it up. Then you realise that you’ll probably end up on youtube as the guy that chased a £5 note on the end of a piece of string. So you don’t go near it. But a lady behind you does, and she ends up £5 richer. You haven’t lost anything here, but you could be £5 up and you’re not. That’s opportunity cost.
How Much Risk to Take
Opportunity cost also highlights an important aspect of risk that I learned during my time on the trading floor. To an extent, risk is good. We all know the old saying about more risk more return, and so it follows that if you want a chance of something good (£5), you have to risk something bad (embarrassing yourself on youtube).
In financial risk management, the amount of risk you take is the single most important metric you consider. Taking too much risk can wipe out all your accumulated profits for the year, and even get you fired. On the other hand, taking too little risk hinders your chances of making any real money. On average, individuals are risk averse, and it was one of the first mental habits I had to get out of when I began trading.
So, what is the right amount of risk? One framework that offers guidance is the Kelly criterion, named after it’s creator John Kelly. In the paper, Kelly proposes that the best way to maximise wealth when repeatedly betting on the flip of a biased coin is to maximise the growth rate of your wealth. His formula instructs you to do this by scaling the size of your bets (as a % of your total wealth) by the size of the bias of the coin. In layman terms, this means that the more likely the positive outcome is, the more you will bet on it.
The Kelly Criterion:
Where
However, your advantage in a game is not always as simple as a coin flip. When making a trade in the markets you can’t be sure of how much edge you have. You don’t know what is, and oftentimes you will be overconfident in your chances of making money. To account for this, a modified approach known as “half Kelly” can be employed. Half Kelly simply takes the amount that the Kelly criterion says you should bet, and halves it.
Whether you size your risk taking based on Kelly or any other method, the idea is the same. The more sure you are of a positive payoff, the more you bet.
Reducing Risk
OK so risk is good, it allows us to make returns. But too much risk is bad. Taking the right amount of risk plays a crucial role in managing uncertainty, preserving capital, and minimising losses. So what can we do to reduce risk? There are only really two things you can do. The first one is obvious and doesn’t need explaining much. That’s to simply take less risk in the first place. However, in areas like financial trading you often find yourself in positions where a client has given you more risk than you want.
The main way to manage this is to hedge. Hedging is a common technique employed to mitigate risk. It involves entering into another bet that is negatively correlated with the bet you are already exposed to. That way, if you are burned on your first bet, you’re making on your second.
However, the decision to hedge should include a cost-benefit analysis. While hedging can be effective in a scenario where risk is undesirable and hedging is cost-free, the reality is often different. Hedging is often expensive and unnecessary, and so your best option here is simply to reduce the size of your exposure to the bet you are already in.
Finally, as I touched on just now, correlation is key to hedging. It is a measure of the statistical relationship between two or more variables, and should be negatively (positively) correlated to your current portfolio of bets in order to reduce risk when you are buying (selling) the hedge. Correlation is also important to understand as holding a portfolio of uncorrelated assets is less risky than holding a portfolio of just one.
Probability Distributions
Another element of risk that is lost when only talking about coin flips is that of probability distributions. In a coin flip, you either get heads or tails. It is discrete. But in reality, especially in financial returns, the outcomes are continuous. This means that instead of your outcomes being bad or good, they now range from very bad to very good, and all the outcomes in between.
Probability distributions represent this continuous spectrum of likelihood over the range of all possible outcomes. Stock returns are often modelled using a normal (Gaussian) distribution as shown below. It is the most common distribution in the natural world, representing everything from height and IQ to reading ability and job satisfaction. In fact, if you flipped a coin an infinite number of times, it would even represent the number of times you get heads (or tails).
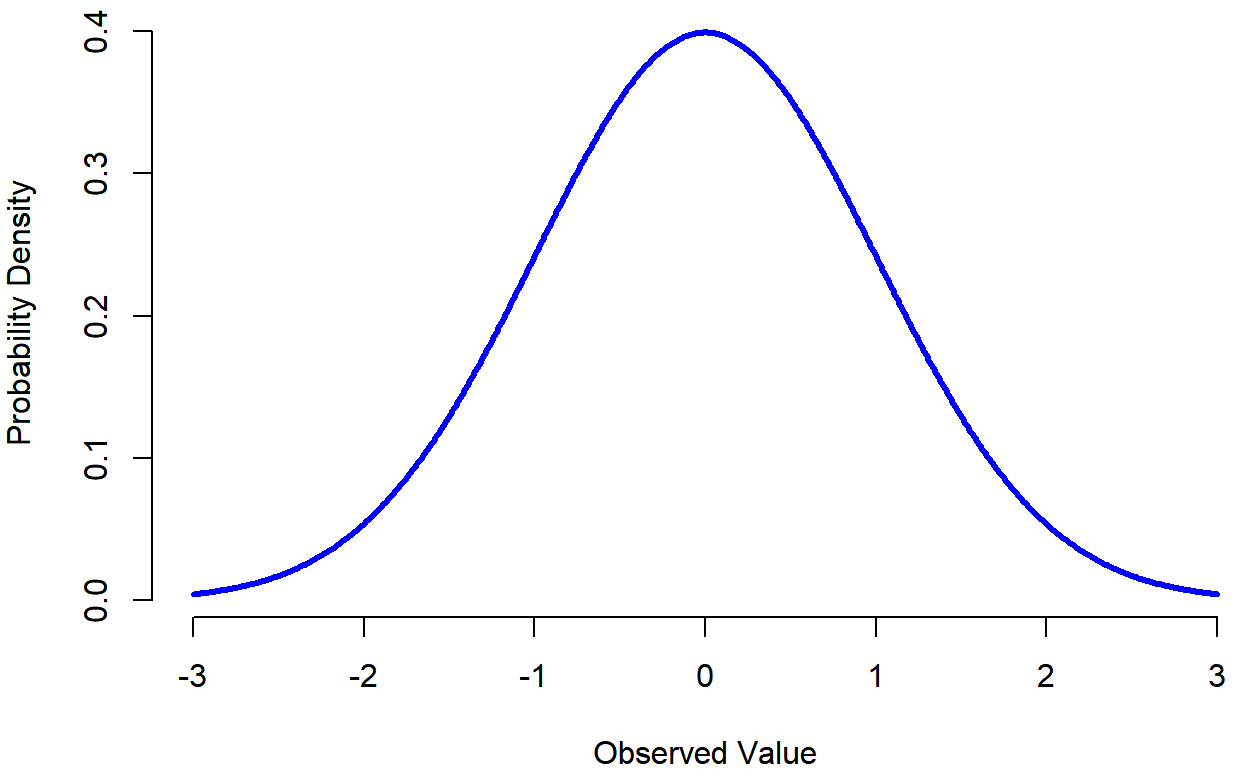
Often the normal distribution is used to model returns of financial instruments too. It’s not perfect, but does a pretty good job. The main thing that it ignores is the “fat tails” of a true return distribution. This is where the returns right at the edges of the distribution are actually more probable than those in the middle. It means that in reality, stocks are more likely to have very large moves than they are to have quite large ones. In statistics we would say that the true distribution has more kurtosis than a normal distribution.
The other thing that a normal distribution doesn’t get quite right about stock returns is that they are not actually symmetric. The true distribution has a heavier tail on the downside than the upside. Meaning stocks are more likely to fall 20% in a day than they are to rise 20% in a day.
So in reality, stock return distributions look more like this:

One last thing to consider about distributions is which ones represent a more risky scenario than others? Which probability distribution is the riskiest? I’m actually not sure about this. Intuitively I would say a distribution with fatter tails is riskier, as is a more asymmetric one. Taking that to the limit suggests the riskiest distribution is that of a biased coin (only tails, slightly asymmetric). But I’ll leave this one open for discussion.
Dimensions of Risk
So far we have only been talking about one type of risk. Or as I like to call it one ‘dimension’: cross sectional risk. Cross-sectional risk focuses on assessing risk in a given snapshot, disregarding the compounding effect over time. This dimension is commonly associated with the traditional perception of risk that comes to mind for most people.
But things are also risky through the dimension of time. This is called Ergodicity. Ergodicity considers risk over time, accounting for the repeated nature of games or scenarios. It recognises that outcomes can vary across iterations, and the cumulative impact of risk may be very different to impact of one iteration. A guy called Dr Ole Peters is the father of this line of thinking and has developed a lot of the research in the area.
The best way to illustrate this concept, imagine a coin flip game where heads result in a 50% profit and tails lead to a 40% loss. Would you play this game? How about repeatedly? You see, in the cross-sectional dimension the game makes sense. If I start with a wealth of 1, then my expected wealth is . But what if we repeatedly play the game? Now the compounding makes the game undesirable. Tails then heads leaves me with . Through the dimension of time, the same gamble is now undesirable.
Ergodicity is a lot more complex than I’ve made out here. And a full explanation would take a lot more than a few paragraphs from me. So I’ll leave it in another piece.
Behavioural Biases Toward Risk
Now then, everything we have mentioned so far is to do with the theoretical side of risk. But in practise, our brains make mistakes and incorrect judgements all the time. We call these biases - tendencies for people to consistently make suboptimal decisions in a certain way.
The most relevant is risk aversion. Risk aversion is a prevalent bias where individuals exhibit a concave utility function. In simple terms, the expected benefit of taking a risk is not worth it, and the individual would prefer to receive a reliable and certain benefit instead. Consider a choice of gambles where I either give you £5, or offer you a coin flip with 50/50 chance of getting £0 or £11. Depending on the level of risk aversion, an individual may choose to take the certainty of £5 over the higher expected value gamble (£5.50).
Additionally, certainty bias pops up a lot in the world of risk management too. It refers to the tendency to overvalue certain outcomes relative to highly likely outcomes. For example if the benefit we expect to get from 100% chance of £100 is 100. Then we would value the benefit of a 99% chance of £100 at less than 99. We are irrationally overvaluing “certain” in comparison to “almost certain”.
Finally we have loss aversion. Loss aversion plays a significant role in risk assessment too, and has even been used to explain the shape of stock return distributions I wrote about earlier. Loss aversion refers to the fact that individuals tend to value the pain from losses more than the benefit from gains. In fact research shows that we value losses about twice as much as gains, meaning that the pain of losing £50 is roughly equivalent to the joy of gaining £100.
Both risk aversion and loss aversion are key biases that are explained by the model of prospect theory. prospect theory. Prospect theory was proposed by Kahneman and Tversky in their book Thinking Fast and Slow (which also explains behavioural biases better than I have). I won’t go into a lengthy explanation of the theory here, but if you’re interested in more on behavioural biases then that’s where I would start.
Optionality
Up until now I’ve implied that there’s always such thing as too much risk. But that isn’t always the case. There is a type of financial instrument called an option. It is a derivative of a stock that gives the holder the option - but not the obligation - to buy (“call”) or sell (“put”) the stock at a predetermined price. The most famous way of valuing options is by using something called the Black-Scholes formula. The formula itself isn’t too important to us here. The main thing I want to highlight is how options relate to the volatility (risk) of the underlying stock. The more volatile the stock, the more valuable the option.
The key aspect of options is that they have limited downside (the price you pay for it), but unlimited upside (the value you can gain from the resulting arbitrage). As you only use (“exercise”) the option if it benefits you.
I’ll use a real-world example to explain it. Suppose you have a bet with a friend about the amount of snowfall over the next week (fun conversation, I know). You can buy an option from him that allows you to earn 1£ per centimetre of rainfall above 2cm. Anything below that and your friend just keeps the amount you paid him for the option. As you can probably see, your option is more valuable if the amount of rainfall is uncertain. If your weatherman really knows his stuff and its 100% certain to be 3cm of snow, then your friend will charge you £1 (3cm - 2cm multiplied by £1). If however, the weatherman says its 50% chance of no snowfall, and 50% chance of 1 metre, then the option would be worth £49 (50% chance of £98 return and 50% chance of £0). There is no limit to this, the more uncertain and volatile next week’s snowfall, the more value is in the option that you two are betting on.
Options are an instrument that represent the concept of optionality, which is discussed in great length in Nassim Taleb’s book Antifragile (highly recommend it by the way). I won’t go into too much detail here, because I’ll probably do Taleb a disservice, but the idea of Antifragility generally says that certain systems or entities can thrive in the face of volatility, rather than simply surviving or succumbing to it.
By harnessing the power of optionality, we can position themselves to benefit from market fluctuations and capitalize on unforeseen opportunities. It is the only way I know of to be positively exposed to risk at all its levels, with no upper limit.
Survival
Another area that Taleb talks about a lot is that of survival, which links directly to antifragility. Nassim Taleb has provided profound insights into risk, particularly through the lens of survival. Considering risk at both the individual and systemic levels is crucial. One of my favourite observations of his is that - paradoxically - a higher risk to the individual can sometimes result in lower risk to the system as a whole.
Drawing inspiration from the evolution of species, we can observe that individual animals regularly face risks and even perish. However, this continual process of natural selection allows the species to adapt and become stronger, reducing the risk of extinction. As long as the risks faced by individuals do not pose an existential threat to the species, these risks ultimately contribute to the resilience and survival of the species.
Likewise, in human systems, carefully managing risks at the individual level can enhance the overall stability and reduce the risk of catastrophic failures. For those of you that want to learn more about these ideas, I can’t recommend a better resource than Taleb’s books, specifically Antifragile.
Entropy
We’re getting further away from the concept of risk itself now, but before finishing I want to talk a bit about entropy. Entropy was introduced by the mathematician Claude Shannon. It represents the degree of uncertainty or randomness within a system. Shannon presented it from the perspective of communication, which is how he developed information theory. The idea is that if you are communicating with somebody, you will get more information from what they say when you have least certainty around what it is they are going to say. From here, Shannon showed that the probability distribution with the most entropy is the uniform distribution, pictured below.

This puts forward the idea of uncertainty as the average deviation from what you expect (standard deviation). Now, of course entropy is much more complex than this. It pops up in thermodynamic physics most often, which I know very little about. But I would be remiss if I didn’t mention it in this essay anyway. Considering entropy in risk assessment can help us understand the level of information or predictability associated with a particular situation. Higher entropy indicates a greater level of uncertainty and, by extension, increased risk.
So that’s about it. If you read all the way down to here then thank you. If you want to reach out about anything I’ve written then please do. And hopefully something here can help you understand - and use - risk in a better way. Think about the different ways risk presents itself. About how the situation is distributed, and what the expected value is. Then consider your own biases when thinking about it. Leverage optionality where you can, provided you are not overpaying for it. And think about how the game plays out through the temporal dimension of risk, not just the cross-sectional dimension. You’ll make better decisions and ideally be able to prevent some undesirable outcomes along the way.
Adios.